One of the drawbacks of using MySQL community is the lack of tools to analyze the server and queries, but with a little help from the Percona Toolkit, this gets a little bit easier.
I tested this on a Ubuntu 16.04 server.
Install
apt-get update
apt-get install percona-toolkit
(Write sudo in front if you are not root-user)
Here is a guide to analyze the queries from the slow query log, with pt-query-digest (that is included in the Percona toolkit):
https://www.olindata.com/blog/2014/08/analysing-slow-mysql-queries-pt-query-digest (dead link)
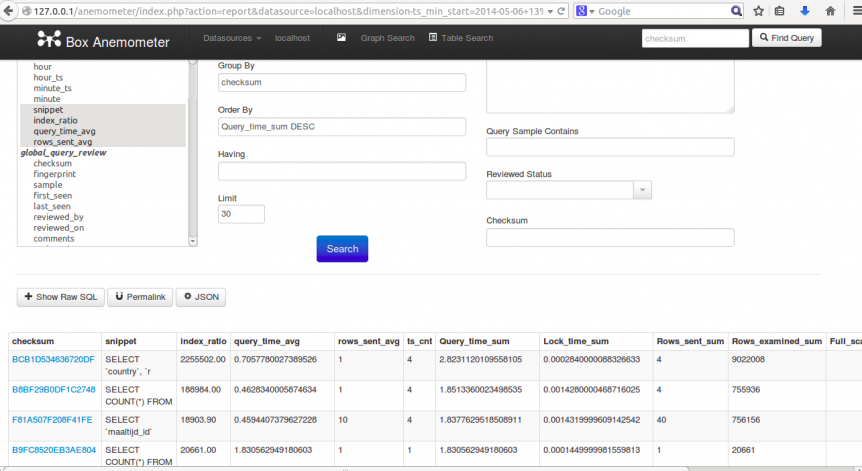
If you want a more GUI-based tool, you can install Box Anemometer (web-application):
https://www.olindata.com/blog/2014/07/anemometer-mysql-slow-query-monitor (dead link)
The array for $conf[‘datasources’][‘localhost’] was located in the datasource_localhost.inc.php file, and not the default config.inc.php.
After Anemometer was set up, I have to run the pt-query-digest to get some data. Here I had to change the user, password and host (h).
$ pt-query-digest --user=anemometer --password=superSecurePass \
                  --review h=db.example.com,D=slow_query_log,t=global_query_review \
                  --history h=db.example.com,D=slow_query_log,t=global_query_review_history \
                  --no-report --limit=0% \
                  --filter=" \$event->{Bytes} = length(\$event->{arg}) and \$event->{hostname}=\"$HOSTNAME\"" \
                  /var/lib/mysql/db.example.com-slow.log
After I opened Box Anemometer in my browser I got a red error message because I had ONLY_FULL_GROUP_BY activated by default. I didn’t need any of the SQL-modes on this server, so I just removed them by running the query: set global sql_mode=»;
Help with SQL-mode: http://stackoverflow.com/questions/23921117/disable-only-full-group-by